The principle of proton exchange membrane fuel cells (PEMFC) is to convert the chemical energy of hydrogen into electrical energy through a series of electrochemical reactions. The efficiency and performance of PEMFC largely depend on the behavior of the materials used, particularly the catalysts on the electrode surfaces. Cyclic voltammetry (CV) is an important electrochemical technique used to study and understand these behaviors. Next, TMN will explore the working principle of cyclic voltammetry in PEMFC testing and its significance in evaluating and improving fuel cell performance.
What is Cyclic Voltammetry
Cyclic voltammetry (CV) is widely used for testing the electrochemical surface area (ECSA) of fuel cell electrodes. CV is typically implemented with the help of a potentiostat in a three-electrode system (an electrochemical cell containing a working electrode, a counter electrode, and a reference electrode). The potential of the working electrode is scanned back and forth between a maximum and a minimum value by the potentiostat, while the current between the working electrode and the counter electrode is recorded to plot a graph of current versus potential, known as a cyclic voltammogram (CV curve). The electrochemical surface area is calculated based on this curve.
Conditions for Cyclic Voltammetry (CV) Testing
Anode: Fully humidified H₂
Cathode: Fully humidified N₂ (or a mixture of N₂ and CO)
The cathode has a significant impact on fuel cell performance, so the electrochemical surface area of the cathode is usually studied (if studying the anode, fully humidified N₂ is fed to the anode and fully humidified H₂ to the cathode). The cathode acts as the working electrode, and the anode simultaneously serves as the reference electrode and the counter electrode. During this process, hydrogen adsorption and desorption reactions of Pt occur as follows:
Hydrogen Desorption Reaction: Pt-H_ads → Pt + H⁺ + e⁻
Hydrogen Adsorption Reaction: Pt + H⁺ + e⁻ → Pt-H_ads
Note: The method of using hydrogen adsorption/desorption to test electrochemical surface area is not suitable for metals that absorb hydrogen or are affected by hydrogen adsorption/desorption. Therefore, for alloy catalysts, the CO stripping method is commonly used to test the electrochemical surface area.
Typical CV Curve
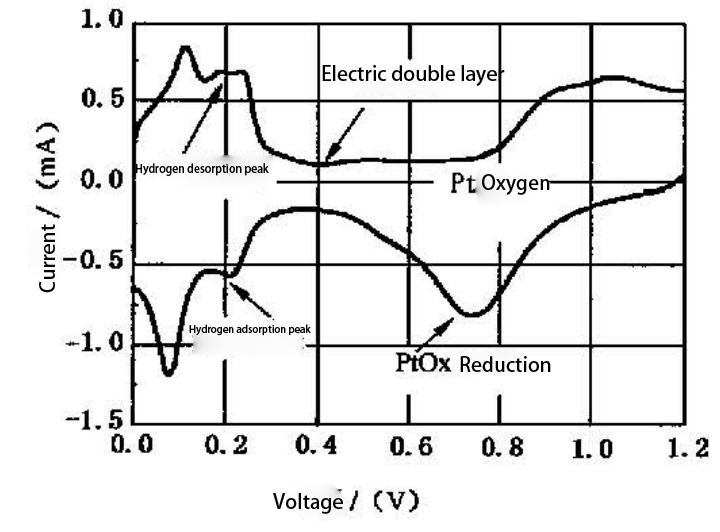
Based on the area of the hydrogen desorption peak obtained from the test and the cyclic voltammetry scan rate, the electrochemical surface area can be calculated using the following formula:
SECA=0.1×SH/(Qr×υ×Mpt)
Where:
SECA: Electrochemical surface area of Pt in the working electrode, in square meters per gram (m²/g)
S_H: Area of the hydrogen desorption peak on the CV curve, in ampere-volts (A·V)
Q_r: Coulombic charge required for hydrogen adsorption on a smooth Pt surface
ν: Cyclic voltammetry scan rate, in volts per second (V/s)
M_pt: Mass of Pt in the electrode, in grams (g)
Basic Principles and Analysis of Cyclic Voltammetry
Cyclic voltammetry (CV) is a transient method used to study the electrochemical properties of systems. By analyzing CV curves, important parameters for investigating electrode processes, reaction mechanisms, and electrode reaction kinetics can be obtained, such as the peak potentials of the cathode and anode (Epc and Epa) and their difference ΔE, as well as the ratio of the peak currents ipc/ipa.
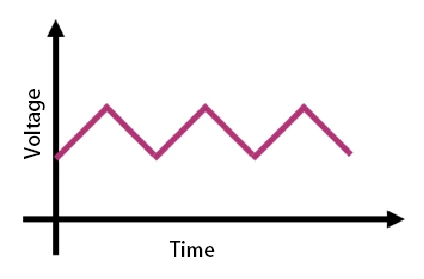
The principle of cyclic voltammetry testing is to scan the potential on the working electrode in a triangular waveform. The potential is scanned at a given rate u from the initial potential Ea to the final potential Ex, and then reversely scanned back to Eo at the same rate, recording the corresponding current-potential (i-E) curve, also known as the voltammogram. The time point at which the potential reverses is called the potential reversal time. The relationship between potential and time can be expressed as: E = Eo + ut, where u is the scan rate, and t is the scan time. During one triangular potential scan, an oxidation and reduction cycle is completed, hence the name cyclic voltammetry.
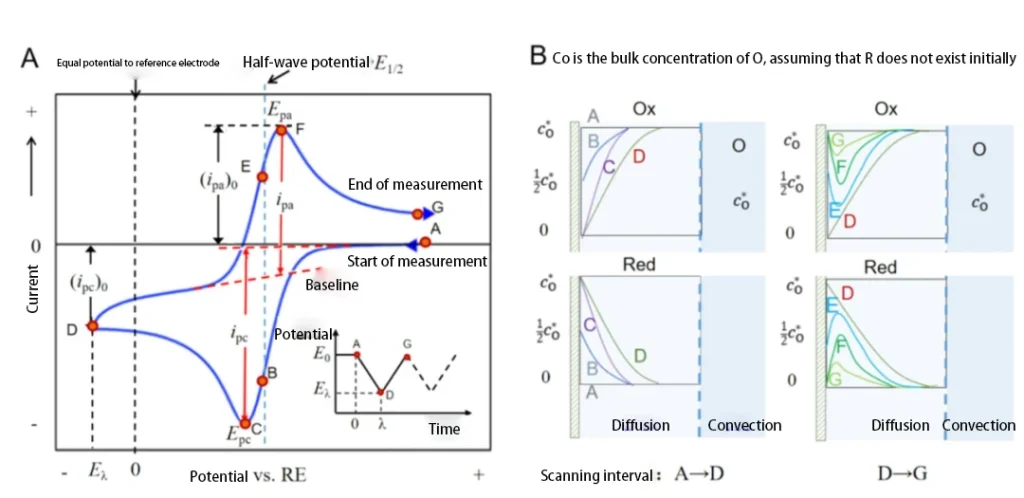
(A) Typical CV curve (the inset shows the potential-time curve)
(B) Schematic diagram of the concentration changes of the redox pair on the electrode surface during the potential scan (assuming the initial concentration of Red is 0)
Common Questions and Answers about Cyclic Voltammetry
Q: What are the important parameters in cyclic voltammetry testing? How should these parameters be selected during measurement?
A: In cyclic voltammetry testing, several key parameters are crucial to the test results and data analysis. Understanding and correctly selecting these parameters is essential for obtaining accurate and reliable data. Here are some important parameters in cyclic voltammetry testing and methods for selecting them:
Important Parameters and Their Selection
1. Initial Potential (Ea) and Final Potential (Ex)
Selection Method: The initial and final potentials should be chosen based on the potential range of the electrochemical reaction being measured. Generally, the initial potential should be within the potential range before the reaction starts, and the final potential should be within the potential range after the reaction is complete. Ensure that the potential range covers the entire electrochemical process.
2. Scan Rate (u)
Selection Method: The scan rate refers to the rate of potential change, usually expressed in volts per second (V/s). The scan rate significantly affects the shape and peaks of the CV curve:
Slow Scan (low u): Helps observe slow electrochemical reactions and electrode processes but may result in lower resolution.
Fast Scan (high u): Helps capture rapid electrochemical reactions but may cause current response lag and curve distortion.
How to select an appropriate scan rate depends on the kinetic characteristics of the reaction and the experimental objectives. Typically, a series of tests at different scan rates are conducted to determine the optimal conditions.
3. Type and Concentration of Electrolyte
Selection Method: The type and concentration of the electrolyte affect the electrochemical environment of the electrode reaction. The appropriate type and concentration of the electrolyte should be chosen based on the characteristics of the reaction and the stability of the reactants and products. Common electrolytes include acidic, alkaline, and neutral solutions.
4. Solution Temperature
Selection Method: The temperature of the solution significantly impacts the rate of electrochemical reactions and electrode processes. Controlling and recording the experimental temperature, and ensuring testing at a constant temperature, helps improve data comparability and reproducibility.
5. Selection of Reference and Counter Electrodes
Selection Method: The reference electrode should have a stable potential to provide an accurate potential reference. Common reference electrodes include the silver/silver chloride (Ag/AgCl) electrode and the saturated calomel electrode (SCE). The counter electrode is typically made of inert materials, such as platinum wire or carbon rod, to ensure no side reactions occur during the electrochemical process.
Q: How to Identify Redox Peaks in Cyclic Voltammetry
A: Identifying the redox peaks in a cyclic voltammetry (CV) plot is a crucial step in electrochemical analysis. Oxidation and reduction peaks represent two different stages of the electrochemical reaction, corresponding to the maximum current of the oxidation and reduction reactions, respectively. The following methods can be used to determine the redox peaks in a CV plot:
Direct Observation Method: By observing the CV curve, identify the points where the current reaches its maximum value. The corresponding potentials are the peak potentials (Epa and Epc), and the currents are the peak currents (ipa and ipc).
Data Smoothing Method: Use techniques such as Savitzky-Golay filtering or other smoothing methods to process the CV data, reducing noise and making the peaks more apparent.
Second Derivative Method: Calculate the second derivative of the CV curve. The points where the second derivative is zero and changes sign correspond to the peaks in the original curve.
Baseline Correction Method: Fit and subtract the baseline current to eliminate background interference, allowing for more accurate identification of peak positions.
Curve Fitting Method: Use models such as Gaussian or Lorentzian functions to fit the peaks and extract the peak positions and magnitudes from the fitted curve.
Q: How to Determine the Redox Peaks in Cyclic Voltammetry
A: Taking the photodegradation reaction as an example, let’s infer its reaction process, where ruthenium bipyridine acts as the oxidant and ascorbic acid as the reductant.
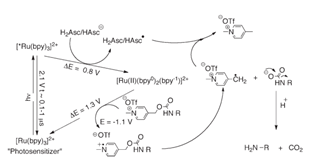
The relationship between activation energy and potential is as follows:
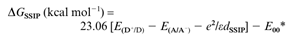
By combining the solvent coefficients, the Gibbs free energy equations for two different reaction processes can be derived:
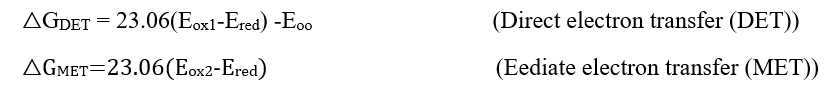
By substituting the potential values, the Gibbs free energy values can be obtained. Based on the sign of the Gibbs free energy, the reaction pathway can be determined.
Read more:
Fuel Cells: Performance Testing Methods for Common Electrocatalysts
Electrode Reactions in Fuel Cells: Anode and Cathode
Practical Applications of Proton Exchange Membrane Fuel Cells
Detailed Explanation of the Structure and Principle of Proton Exchange Membrane Fuel Cells