
Accurate performance characterization methods are crucial in the study of electrocatalyst performance. This article will detail several common electrocatalyst performance testing methods, including Single battery, rotating disk electrode (RDE) and rotating ring-disk electrode (RRDE) testing, cyclic voltammetry (CV), and linear sweep voltammetry (LSV). Each method has its unique advantages and applicable scope. Understanding the basic principles and application scenarios of these methods will help to more comprehensively and accurately evaluate the performance of electrocatalysts, thereby advancing research in fuel cells and other electrochemical applications.
Single battery
One important method for characterizing the performance of electrocatalysts is to mix the electrocatalyst, alcohol, water, and proton-conducting resin in a certain ratio to form a slurry. This slurry is then sprayed or brushed onto a proton exchange membrane or gas diffusion layer, and a membrane electrode is obtained by hot pressing. The catalytic performance is evaluated using the Single battery method, which allows for comparison of different electrocatalysts.
This method is highly effective, especially in the field of fuel cell research, as it can evaluate the electrochemical performance of catalysts under actual working conditions and consider factors such as catalyst distribution in the membrane electrode, proton conductivity, and gas diffusion. However, the preparation conditions of the membrane electrode significantly impact the evaluation of electrocatalyst performance. Single battery measures the overall performance of the electrocatalyst but does not allow for in-depth research into the catalytic reaction mechanisms on the surface of the electrocatalyst.
Rotating Disk Electrode and Rotating Ring-Disk Electrode Methods
The Rotating Disk Electrode (RDE) and Rotating Ring-Disk Electrode (RRDE) are two commonly used electrochemical testing methods for evaluating the performance of electrocatalysts. These methods can quickly assess the initial electrochemical performance of electrocatalysts, such as activity, stability, and reaction mechanisms, in a relatively short time. They are particularly suitable for studying the mechanisms of electrochemical reactions, such as the oxygen reduction reaction (ORR). By controlling the rotation speed, these methods can precisely control the mass transfer process, providing stable and highly reproducible testing conditions.
Rotating Ring-Disk Electrode (RRDE): This is an electrochemical measurement technique developed from the RDE and is especially suitable for detecting intermediate products in electrochemical reactions. If a reduction reaction occurs on the disk electrode, the generated intermediate products will be carried by the solution flow to the ring electrode. By applying a potential to the ring electrode that can oxidize the intermediate products, the oxidation reaction current can be detected on the ring electrode, thus allowing further study of the reaction pathway and the formation and consumption of intermediate products.
Compared to Single battery methods, RDE and RRDE are more suitable for preliminary performance evaluation and reaction mechanism studies, while Single battery provides a more comprehensive evaluation of the catalyst’s overall performance under actual working conditions. For ORR testing, the production rate of H2O2 and the electron transfer number (n) during the oxygen reduction process on the electrocatalyst can be calculated using the following formula:
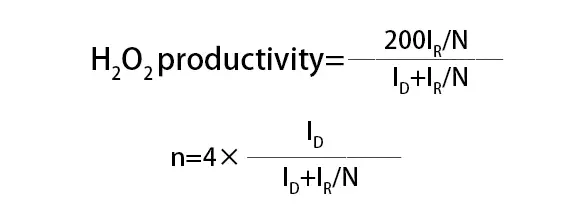
where ID is the Faradaic current on the disk electrode,IR is the Faradaic current on the ring electrode, and N is the collection efficiency of the disk electrode for H2O2.
Cyclic Voltammetry (CV)
Cyclic Voltammetry (CV) is a commonly used electrochemical transient experimental method for studying reaction kinetics and mechanisms. By controlling the electrode potential to scan in a triangular waveform at different rates over time, alternating reduction and oxidation reactions occur on the electrode, and the current-potential curve, known as the cyclic voltammogram, is recorded.
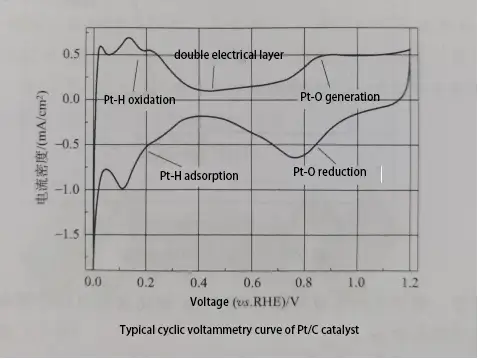
The figure shows a typical CV curve for a Pt/C catalyst, divided into five parts: hydrogen adsorption peak, double-layer region, surface Pt oxidation peak, Pt oxide reduction peak, and hydrogen desorption peak. From the hydrogen desorption curve on the Pt electrode in the CV curve, the electrochemical active surface area (ECSA) of the electrocatalyst can be calculated, which is the surface area of electrochemical activity per unit mass of platinum, commonly measured in m²/g. The calculation formula is as follows:
ECSA=Q/(mC)
Q=S/u
where Q is the total charge of the hydrogen desorption peak in the CV curve after removing the double layer, m is the loading of Pt on the electrode, C is the unit adsorption capacitance of a monolayer of hydrogen on the Pt surface (210μC/cm²), S is the integrated area of the hydrogen desorption peak in the CV curve, and u is the scan rate during the CV test. ECSA is one of the important parameters for evaluating platinum-based electrocatalysts.
Cyclic Voltammetry (CV)
Cyclic voltammetry (CV) is widely used to characterize the electrochemical surface and stability of fuel cell electrocatalysts. During a CV test, the electrode potential is repeatedly swept between selected lower and upper limits while the current response is recorded.
The resulting current-potential curve, or cyclic voltammogram, can reveal surface adsorption and desorption, oxidation and reduction behavior, double-layer charging, and changes in the electrochemically active catalyst surface.
For Pt-based PEM fuel cell catalysts, CV is commonly used to estimate the electrochemically active surface area (ECSA). ECSA indicates how much Pt surface is accessible for electrochemical reactions rather than simply how much Pt is present in the electrode.
CV Testing in PEM Fuel Cells
CV can be performed in a conventional three-electrode electrochemical cell or directly in a PEM fuel cell.
In an in-situ PEMFC measurement, the electrode being characterized acts as the working electrode. When the cathode catalyst is evaluated, hydrogen is normally supplied to the anode while an inert gas such as nitrogen is used on the cathode side. The hydrogen electrode can then serve as the reference and counter electrode for the measurement.
The potential is swept through a defined range while the current response of the working electrode is recorded.
Exact test conditions should always be reported because the resulting CV curve depends strongly on the measurement protocol. Important conditions include:
- potential range,
- scan rate,
- temperature,
- relative humidity,
- gas composition and flow,
- pressure,
- catalyst loading,
- electrode history and conditioning.
There is no single scan rate or potential window that applies to every CV experiment. The conditions should match the catalyst system and the purpose of the test. Published PEMFC protocols, for example, use different voltage ranges and scan rates depending on whether the objective is ECSA measurement, catalyst degradation analysis, or accelerated durability testing.
For this reason, ECSA or CV curves from different studies should not be compared without first checking whether the measurement conditions are equivalent.
How to Read a Typical Pt/C CV Curve
A typical CV curve for a Pt/C electrocatalyst contains several characteristic regions:
- Hydrogen adsorption and desorption region
- Double-layer region
- Pt surface oxidation region
- Pt oxide reduction region
The hydrogen adsorption and desorption region is particularly important for Pt-based catalysts because its integrated charge can be used to estimate ECSA.
The double-layer region mainly reflects non-Faradaic charging of the electrode-electrolyte interface. At higher potentials, Pt surface oxide forms during the forward scan and is reduced during the reverse scan.
Changes in these features after durability testing can provide information about catalyst-surface evolution. A decrease in the hydrogen adsorption/desorption area, for example, may indicate a loss of electrochemically accessible Pt surface. Changes in oxide-related peaks can also reflect changes in the Pt surface or catalyst-support system.
Calculating ECSA from Hydrogen Adsorption or Desorption
For Pt catalysts, ECSA can be estimated from the charge associated with hydrogen adsorption or desorption after correcting for the double-layer background.
A commonly used form is:

where:
- (Q_H) is the integrated hydrogen adsorption or desorption charge,
- (m_{Pt}) is the Pt mass in the tested electrode,
- (q_H) is the reference charge required for a hydrogen monolayer on Pt.
A commonly used reference value for polycrystalline Pt is approximately:

The integrated peak area must be converted to charge using the CV scan rate. Accurate baseline correction is also important because double-layer current should not be included in the hydrogen charge.
The final result is normally expressed as surface area per unit Pt mass, such as (m^2/g_{Pt}). This allows catalysts with different Pt loadings to be compared on the basis of electrochemically accessible surface rather than total metal mass. The hydrogen-charge approach and the approximately 210 μC/cm²Pt reference value are widely used for Pt-based PEMFC electrodes.
Why Scan Rate and Potential Range Matter
The scan rate affects both the current response and the shape of the CV curve.
At a slower scan rate, the electrochemical system has more time to respond to changes in potential. A faster scan may increase measured current but can also increase capacitive effects and make some features harder to interpret.
The potential window is equally important. It must include the electrochemical region required for the measurement without unnecessarily exposing the catalyst or support to potentials that can alter the surface.
This means that two CV curves should not be compared simply because they were measured on similar catalysts. The scan rate, potential limits, temperature, humidity, gas environment, and conditioning history should also be comparable.
For durability studies, the same protocol should be maintained before and after aging so that a change in ECSA reflects catalyst degradation rather than a change in test conditions.
Limitations of ECSA Measurement by Hydrogen Adsorption
Hydrogen adsorption/desorption is especially useful for conventional Pt catalysts, but it is not universally applicable to every electrocatalyst.
The hydrogen signal can become difficult to interpret when:
- alloying changes the Pt surface adsorption behavior,
- the catalyst itself absorbs hydrogen,
- surface contaminants interfere with hydrogen adsorption,
- hydrogen crossover or background current distorts the CV curve,
- very low catalyst loading reduces signal quality.
For some Pt-alloy or other catalyst systems, CO stripping voltammetry can provide an alternative way to estimate electrochemically accessible surface area.
The selected method should therefore match the catalyst composition and the objective of the experiment rather than applying the same ECSA calculation to every material.
What CV Can and Cannot Tell You
CV is valuable for evaluating:
- electrochemically active surface area,
- catalyst-surface changes,
- hydrogen adsorption and desorption behavior,
- Pt oxidation and reduction features,
- catalyst degradation before and after durability testing.
However, a high ECSA does not automatically mean that a catalyst will deliver the highest fuel cell performance.
CV mainly characterizes electrochemically accessible surface properties. It does not by itself fully describe oxygen-reduction activity, mass-transport limitations, membrane-electrode interactions, or complete single-cell performance.
For this reason, CV should normally be interpreted together with complementary techniques. RDE or RRDE can evaluate intrinsic ORR activity and reaction pathways, LSV can provide polarization-related information, and single-cell testing can determine whether the catalyst maintains its performance under realistic PEM fuel cell operating conditions.
Linear Sweep Voltammetry
Linear Sweep Voltammetry (LSV) involves applying a linear potential sweep (where potential changes linearly with time) between the working electrode and the reference electrode, while measuring the current flowing between the working electrode and the auxiliary electrode to obtain a polarization curve. A typical oxygen reduction reaction (ORR) polarization curve can be divided into three regions: the kinetic control region, the mixed kinetic-diffusion control region, and the diffusion control region.
Kinetic Control Region: In this region, the ORR reaction rate is relatively slow, resulting in a small or almost negligible current. As the potential decreases, the current density increases slowly.
Mixed Kinetic-Diffusion Control Region: As the potential continues to decrease, the ORR reaction rate accelerates, evidenced by a significant increase in current density with the decreasing potential. In this region, the ORR rate is determined by both the intrinsic kinetic rate of the reaction and the diffusion rate of oxygen.
Diffusion Control Region: In this region, the intrinsic kinetic rate of the reaction surpasses the diffusion rate of oxygen. This means the rate of oxygen reduction on the surface of the electrocatalyst far exceeds the rate at which oxygen can diffuse from the bulk electrolyte to the surface of the electrocatalyst. Consequently, the ORR rate is controlled by the diffusion rate of oxygen, and the polarization curve in this region forms a limiting current density plateau where the current density does not change with potential.
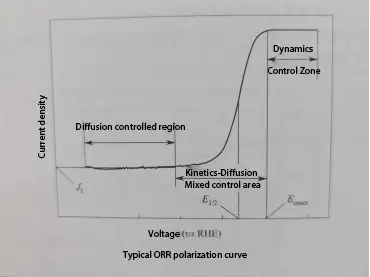
In an ORR polarization curve, two parameters can indicate the electrocatalytic activity of the catalyst: onset potential (Eonset) and half-wave potential (E1/2).
Onset Potential (Eonset):
The onset potential is the potential value at the boundary between the kinetic control region and the mixed kinetic-diffusion control region in the polarization curve. Different measurement methods are used in various studies, including:
The potential value at 5% of the limiting current density.
The potential value at a current density of 0.1 mA/cm².
The intersection of the tangent at the point of maximum slope in the mixed kinetic-diffusion control region with the current density of zero.
Half-Wave Potential (E1/2):
The half-wave potential is the potential value at which the current density is half of the limiting current density. This parameter reflects the intermediate potential activity of the electrocatalyst in ORR.
To calculate the number of electrons transferred during the ORR process for different electrode rotation speeds, the Koutecky-Levich (K-L) equation is used:
1/ID=1/IK+1/(Bw1/2)
where ID is the measured current,IK is the kinetic current, w is the electrode rotation speed (rpm or rad/s), and B is the inverse of the slope, calculated using the Levich equation:
B=0,62nFAC0D02/3 ν-1/6
where n is the number of electrons transferred per oxygen molecule, F is the Faraday constant (96485 C/mol), D0 is the diffusion coefficient of O2,C0 is the concentration of O2 in the electrolyte, and ν is the kinematic viscosity of the electrolyte.
The introduction above demonstrates the important applications of various electrocatalyst performance testing methods in electrochemical research. By comprehensively using these methods, researchers can more accurately characterize the performance of electrocatalysts, thereby advancing the technology of fuel cells and other electrochemical applications.
Related articles:
ORR reaction mechanism of Proton exchange membrane fuel cells