
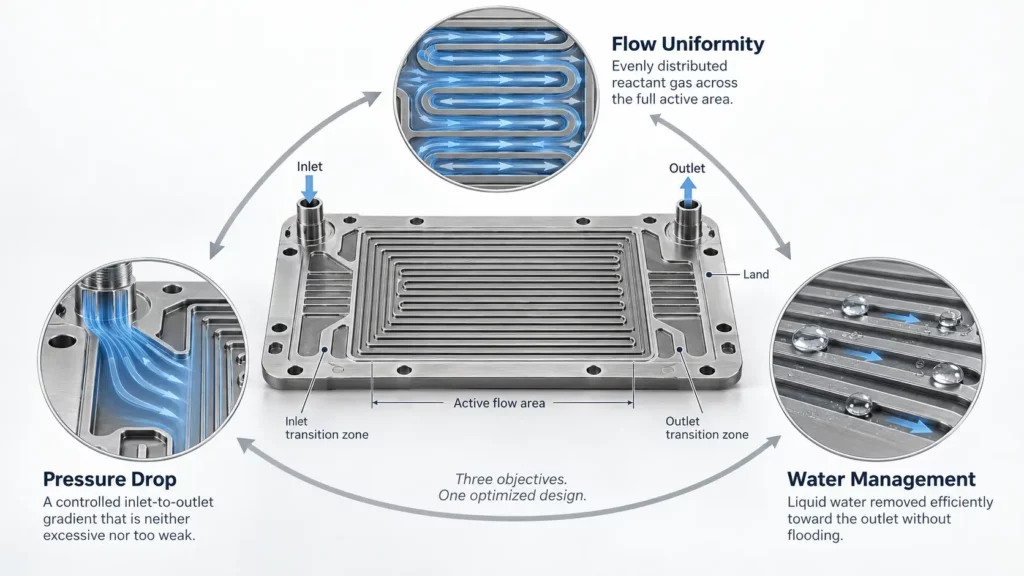
An efficient fuel cell flow field must distribute reactants evenly, remove excess water, and maintain an acceptable pressure drop across the active area. These goals often conflict. A design that improves drainage may increase compressor demand, while a low-resistance design may allow uneven flow and local oxygen starvation.
Fuel cell flow field optimization therefore requires more than choosing a serpentine or parallel pattern. Engineers must assess pressure, local velocity, water transport, manufacturing tolerance, CFD, and prototype performance as one system. This guide explains how to optimize and validate a PEM fuel cell flow field after the basic geometry has been selected.
Key Takeaways
- The lowest pressure drop is not always the best design.
- Flow uniformity matters as much as total flow rate.
- Water removal and membrane hydration must remain balanced.
- Channel dimensions affect pressure drop, velocity, and manufacturability together.
- CFD should find distribution risks before plates are manufactured.
- Prototype measurements are still needed to validate simulation results.
- Manufactured geometry, not nominal CAD geometry, controls actual flow behavior.
What Makes a Fuel Cell Flow Field Efficient?
An efficient flow field distributes reactants across the active area, creates enough pressure gradient for gas movement and drainage, manages water without drying the membrane, and can be manufactured consistently.
No single metric defines the best design. Lower pressure drop can reduce auxiliary power but weaken drainage or increase flow variation. Added channel complexity may improve transport yet increase sensitivity to dimensional error.
| Design Objective | Too Low or Too Weak | Too High or Too Strong |
|---|---|---|
| Pressure drop | Poor distribution or drainage | High pumping losses |
| Gas velocity | Weak mass transport | Higher flow resistance |
| Water removal | Flooding | Possible membrane dry-out |
| Channel complexity | Limited distribution control | Manufacturing and validation difficulty |
| Dimensional tolerance | Larger flow variation | Higher manufacturing cost |
The aim is not to maximize one variable. It is to balance transport, energy use, water behavior, and production repeatability.
Pressure Drop vs Flow Uniformity
Why Pressure Drop Matters
Flow field pressure drop is the difference between inlet and outlet pressure:
ΔP=Pinlet−Poutlet
This difference drives reactant gas through the channels, assists drainage, and contributes to blower, compressor, or recirculation load.
Pressure drop must be evaluated at cell and system levels. Better local transport can reduce net system efficiency if pumping demand becomes too high, while larger pressure differences can increase sealing and manifold demands.
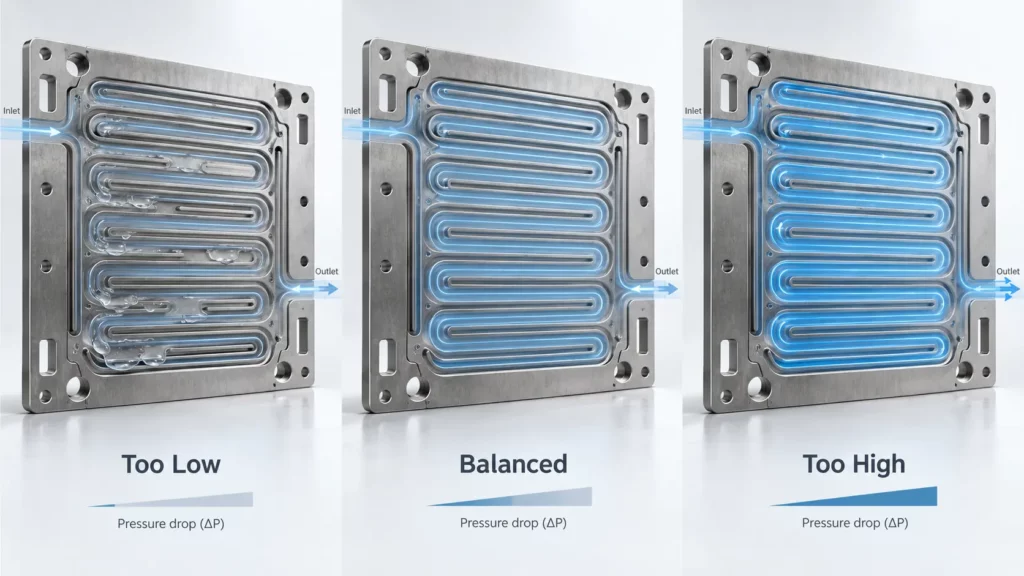
Minimum pressure drop is not the objective. Controlled pressure drop is.
What Happens When Pressure Drop Is Too High?
Excessive resistance raises compressor or pump power. Cell performance may improve while net system performance falls. Larger pressure differences can also complicate manifold balance and sealing.
What Happens When Pressure Drop Is Too Low?
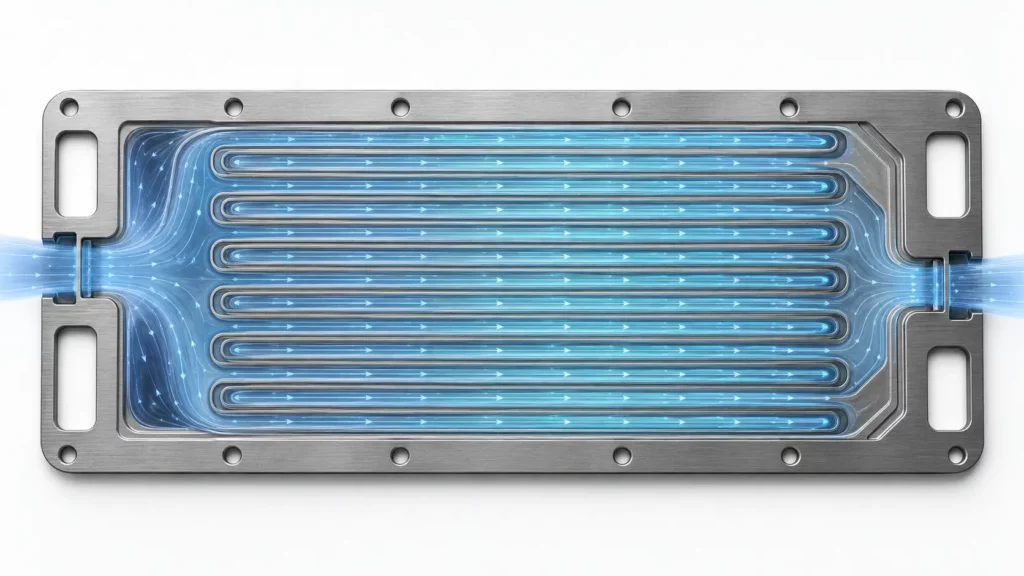
Very low resistance does not guarantee good fuel cell flow distribution. In parallel layouts, small differences in channel resistance, manifold pressure, or water blockage can redirect gas toward the easiest paths.
Low-flow zones may then develop even when the total inlet flow appears sufficient. These zones are more likely to retain water and experience local reactant shortage.
Channel Geometry Changes Pressure and Distribution Together
Narrower, shallower, or longer channels generally increase hydraulic resistance. Dividing the flow among more parallel paths usually reduces total pressure drop, but it can increase the risk of maldistribution.
These relationships support early screening, but final dimensions must reflect the operating range and manufacturing process. For width, depth, rib geometry, ports, and transition zones, see bipolar plate structural design.
Water Management and Mass Transport
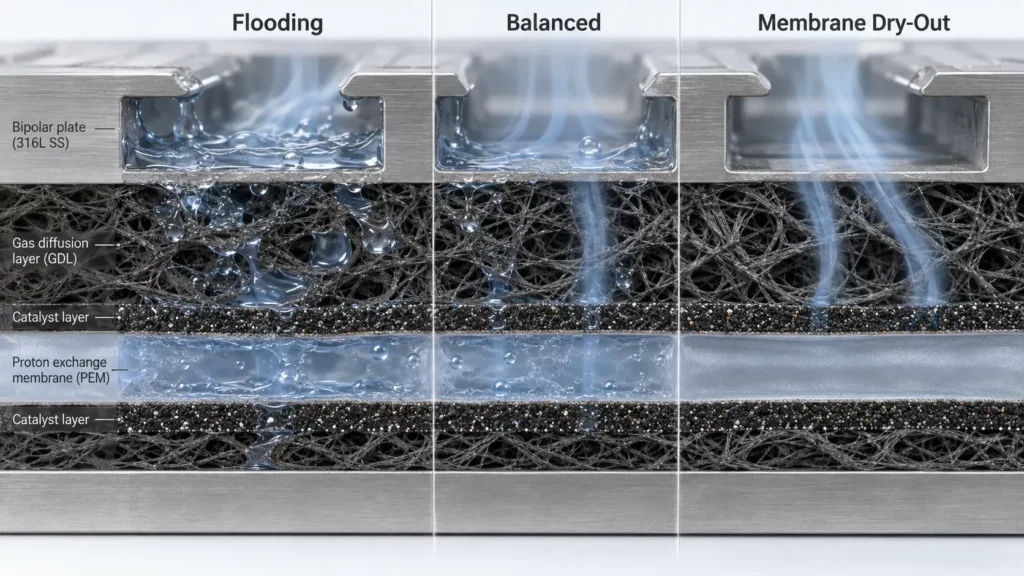
Water management in fuel cells involves two opposite risks. Excess liquid water can block transport paths and cause flooding. Too little water can reduce membrane hydration and increase ionic resistance.
The flow field must remove excess liquid while keeping the membrane electrode assembly hydrated. The U.S. Department of Energy describes the same balance in the gas diffusion and microporous layers: retain water for membrane conductivity, but release it to keep transport pores open.
How Flooding Reduces Performance
Accumulated water can restrict channels or occupy GDL pores. Oxygen access falls, mass-transport loss rises, and local voltage can drop. The risk is often greater at high current density, near outlets, or in low-velocity areas.
Gas velocity affects this behavior. Higher velocity and shear can help move droplets toward the outlet. Insufficient velocity encourages accumulation, but excessive velocity or pressure drop increases auxiliary energy use and may make hydration control harder.
Channel type alone does not control water. Two serpentine plates can behave differently because of dimensions, path length, inlet flow, temperature, humidity, current density, surface condition, or GDL properties. Use realistic operating inputs, not pattern names alone.
Flow Maldistribution and Local Reactant Starvation
Total flow rate does not show how much reactant reaches each channel or active-area region. A cell can receive enough hydrogen or air overall while local areas remain under-supplied.
Causes include unequal channel resistance, poor manifold transitions, plate variation, water blockage, and pressure imbalance. Effects include non-uniform current density, local starvation, hot spots, unstable voltage, and faster degradation.
Current-density mapping is useful because it reveals spatial behavior that a polarization curve can hide. Published PEMFC current-distribution research shows how local measurements can help relate operating conditions to dry-out, flooding, and current-density non-uniformity.
Transition zones deserve special attention. A narrow port or abrupt expansion can create uneven entry conditions before gas reaches the main channels. See bipolar plate structural design for port and distribution-zone geometry.
Manufacturing Accuracy Changes Flow Field Performance
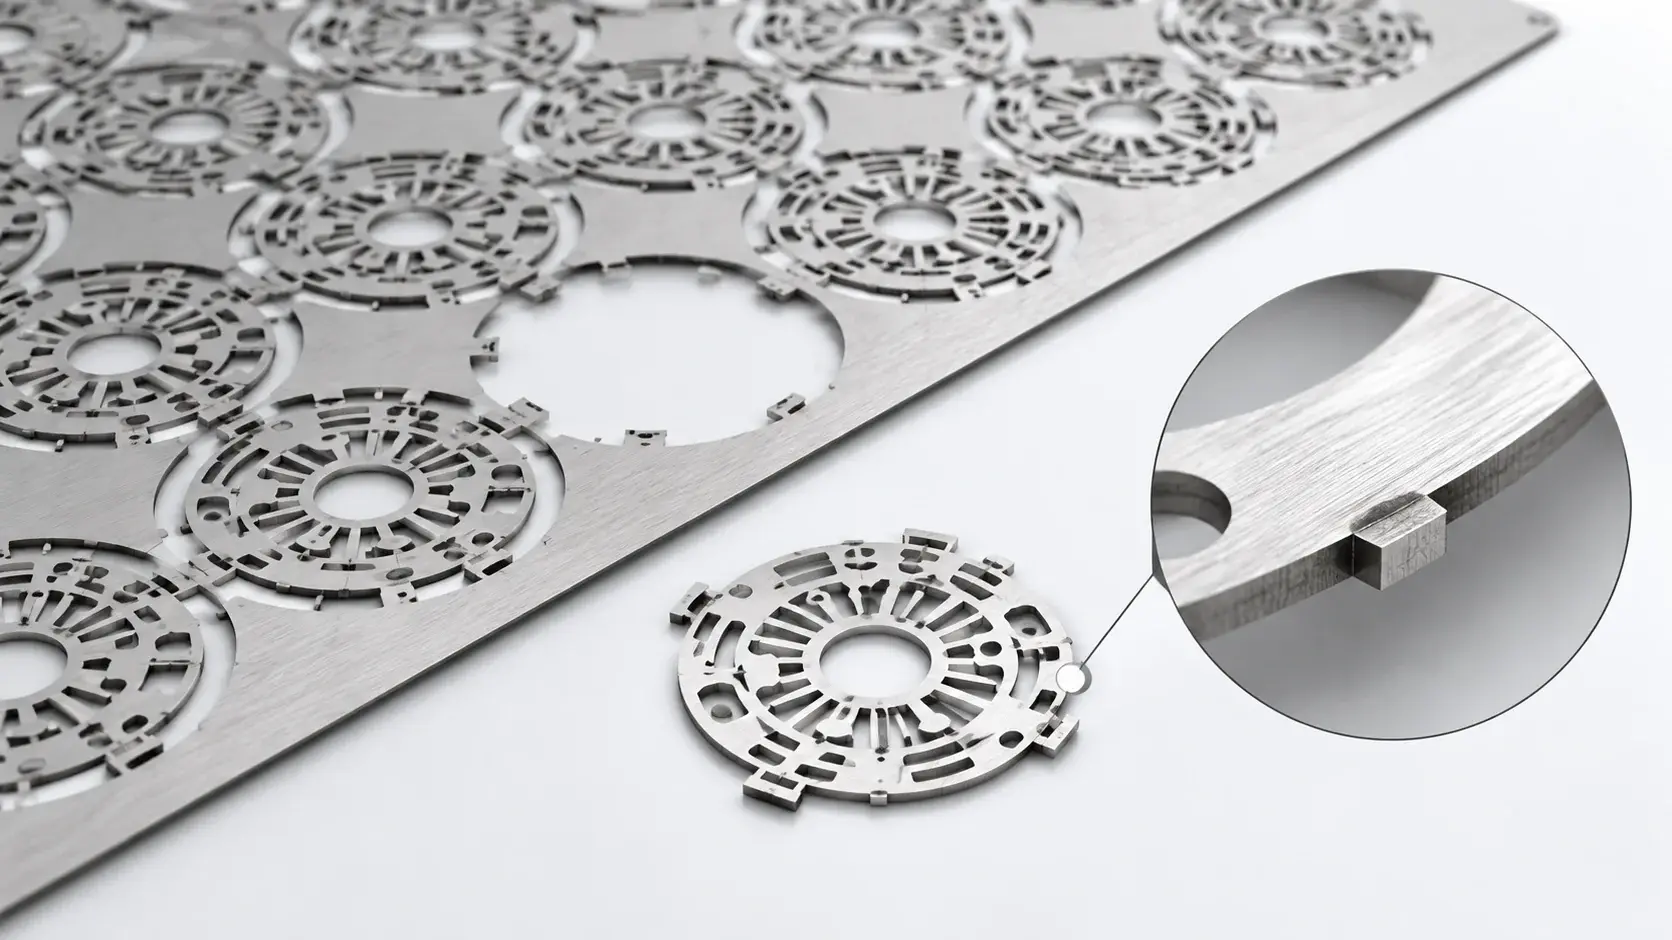
CFD usually evaluates ideal geometry, but a fuel cell operates with manufactured geometry. Channel profile, flatness, alignment, surface condition, and compression define the real flow path.
Critical manufacturing variables include:
- Channel depth and width
- Land or rib width
- Port and transition geometry
- Plate flatness
- Layer and port alignment
- Burrs, draft, thinning, or deformation where applicable
- Plate-to-plate consistency
Small deviations matter more in fine channels. The same depth error represents a larger share of a shallow channel area and can change resistance, velocity, and flow splitting.
A peer-reviewed study of PEMFC channel tolerances found that channel variation can affect pressure drop and performance uniformity. Tolerances should therefore follow function, not a general drawing default.
| Feature | Main Function Affected |
|---|---|
| Channel depth | Pressure drop and gas velocity |
| Channel width | Flow capacity and distribution |
| Land width | Electrical contact and gas access |
| Flatness | Sealing, compression, and contact |
| Alignment | Port and channel continuity |
| Transition zone | Distribution into the active area |
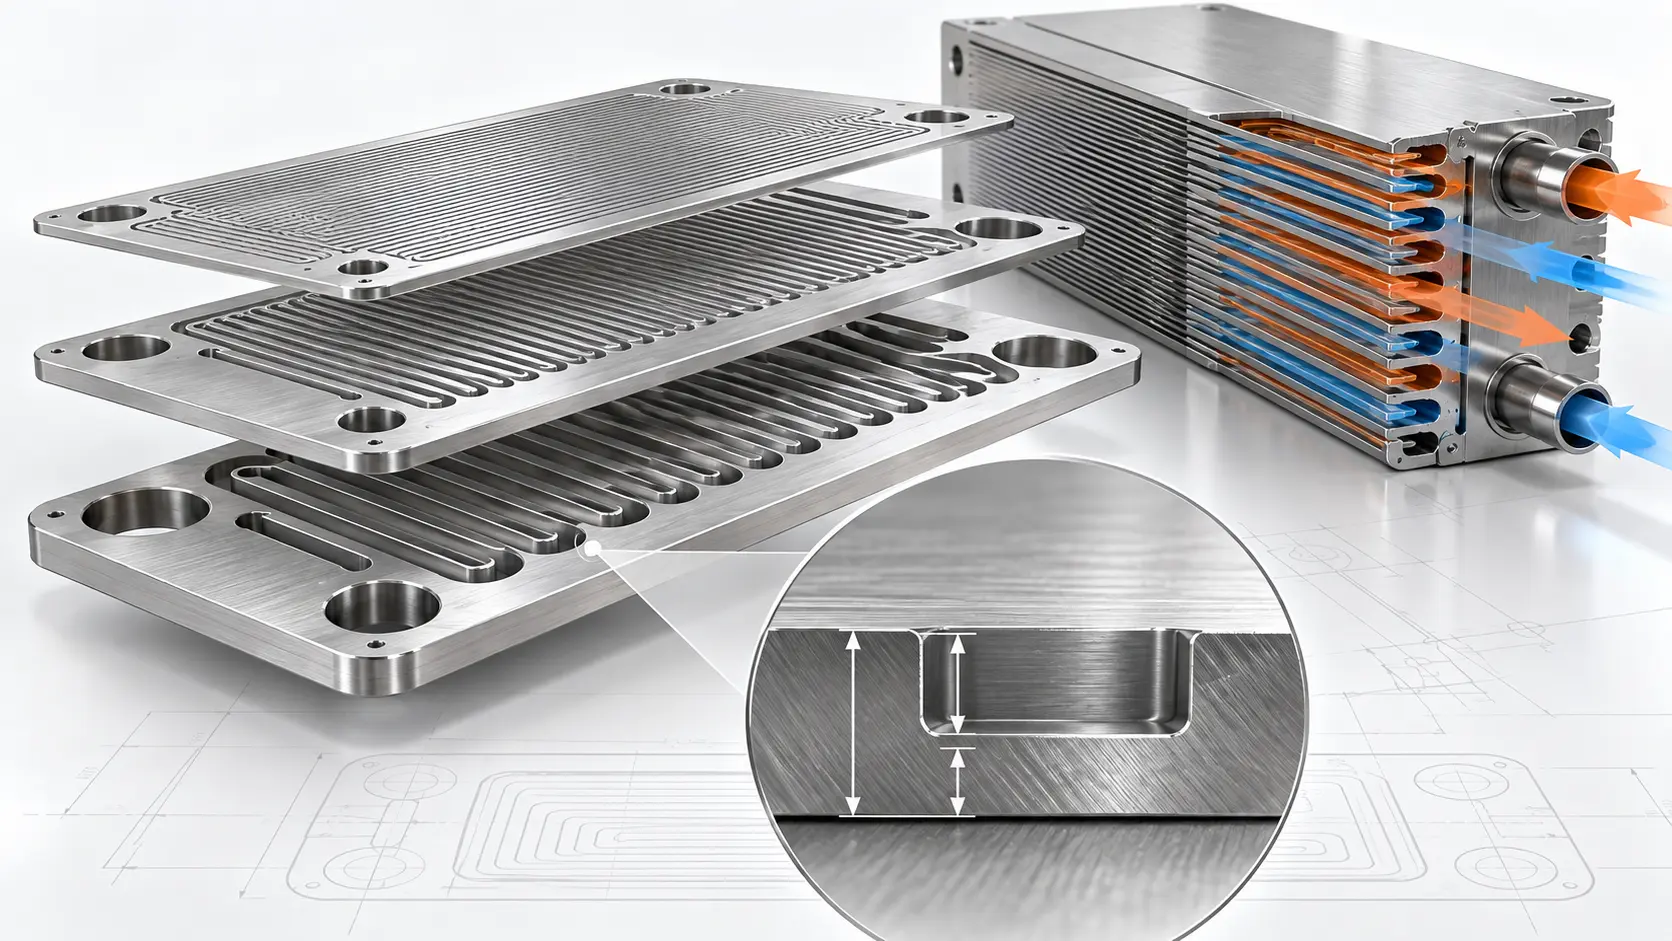
For etched metal plates, review thickness, etch depth, minimum land or web width, multi-depth features, alignment, and inspection together. Early DFM review reduces the risk of a CFD-optimized geometry becoming unstable or costly in production.
Teams developing metal flow fields can use custom bipolar plate manufacturing to compare CAD geometry with achievable etched features before prototyping.
Typical Tolerance Impact Cases
Case 1: Channel Depth Error Causes Pressure Drop Shift and Flow Maldistribution
A PEM fuel cell uses chemically etched stainless steel bipolar plates with a nominal channel depth of 0.20 mm, width of 0.30 mm, and flow path length of 150 mm. A single-phase CFD model predicts a single-cell pressure drop of 12 kPa at rated flow.
Manufacturing deviation: Due to fluctuations in etchant concentration and etch time control, the measured channel depth ranges from 0.17 to 0.19 mm (average 0.18 mm), representing a 10% negative deviation from the target depth.
Observed effects:
The channel cross-sectional area decreases by approximately 10%, reducing the hydraulic diameter and significantly increasing laminar flow resistance.
The measured single-cell pressure drop rises to 15.8 kPa (+32%), exceeding the upper limit of the compressor operating window.
In a parallel multi-channel layout, shallower channels exhibit higher resistance, causing gas to preferentially flow through adjacent deeper channels. Local flow velocity differences reach 18%.
High-resistance channels accumulate liquid water, increasing voltage fluctuation by 5–8 mV per cell at high current density.
Engineering implication: For etched flow fields with depths ≤0.2 mm, channel depth tolerance should be controlled within ±0.01 mm (±5%). Critical regions must be verified during DFM review using cross-sectional metallography or confocal microscopy to ensure depth consistency.
Case 2: Channel Width and Land Width Ratio Deviation Degrades Both Contact Resistance and Mass Transport
A metallic bipolar plate is designed with a channel width of 0.40 mm and land width of 0.30 mm, targeting a balance between sufficient gas diffusion layer (GDL) contact area and adequate mass transport channels.
Manufacturing deviation: Stamping die wear reduces the actual channel width to 0.34 mm while increasing land width to 0.36 mm (total pitch remains 0.70 mm).
Observed effects:
The increased land width enlarges the GDL compression area, reducing local contact resistance by approximately 12%, which initially appears beneficial.
However, the channel cross-sectional area decreases by 15%, raising local gas velocity and increasing pressure drop by 9 kPa.
More critically, the expanded land region compresses GDL pores, hindering oxygen diffusion to the catalyst layer. Concentration polarization losses increase by 25 mV at high current density (>1.5 A/cm²).
Narrower channels are also more prone to liquid water blockage, reducing drainage capability and degrading voltage stability under dynamic operating conditions.
Engineering implication: Channel width and land width are coupled design variables. Manufacturing tolerances should control the channel-to-land width ratio (e.g., 1.33 ± 0.1) rather than individual dimensions alone. Performance must be validated jointly using four-probe contact resistance measurements and polarization curves to confirm the balance between electrical contact and mass transport.
CFD for Fuel Cell Flow Field Optimization
Fuel cell flow field CFD should answer design questions, not only produce contour plots. Evaluate velocity, pressure drop, reactant concentration, low-flow regions, water risk, and temperature.
Compare designs under the same inlet flow or stoichiometry, outlet pressure, temperature, humidity, gas composition, operating current, and material assumptions. Otherwise, a changed input may appear to be a geometry improvement.
Look beyond averages and color maps. Extract velocity range, channel-to-channel flow variation, inlet-to-outlet pressure, oxygen gradients, and hot-spot or water-prone locations. State the uniformity metric so the comparison is reproducible.
A channel-only, single-phase model can support hydraulic screening but cannot prove electrochemical or two-phase performance. Add transition zones, GDL compression, heat, phase change, and wetting as the design matures.
CFD is a design-screening and optimization tool. It is not final proof. Experimental studies that compare PEMFC simulation with measured performance demonstrate why model validation remains part of a credible workflow.
How to Validate a Fuel Cell Flow Field Prototype
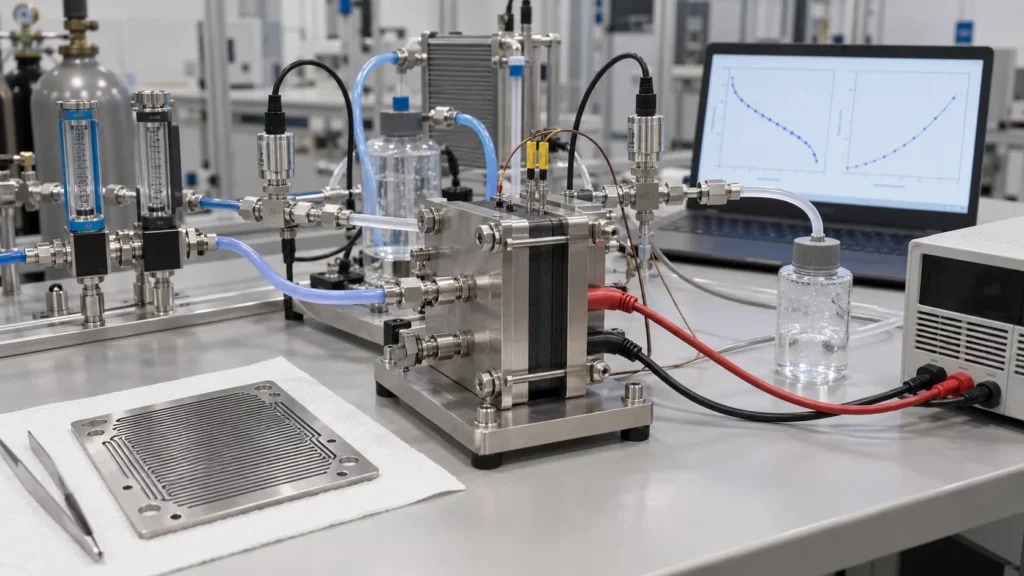
Prototype validation should connect hydraulic behavior, electrochemical output, local distribution, water, temperature, and manufactured dimensions.
| Test | What It Verifies |
|---|---|
| Pressure-drop measurement | Actual hydraulic resistance |
| Flow-distribution test | Channel-to-channel uniformity |
| Polarization curve | Overall electrochemical performance |
| Current-density mapping | Local reactant distribution |
| Water visualization or inspection | Flooding and drainage behavior |
| Thermal measurement | Hot spots and temperature uniformity |
| Dimensional inspection | CAD geometry versus manufactured plate |
If simulation and measurement disagree, check actual dimensions, boundary conditions, gas properties, surface condition, compression, sealing, and water behavior. Repeating CFD with measured geometry can separate model error from manufacturing variation.
Test at low load, rated load, and high current density across expected temperature, pressure, humidity, and stoichiometry ranges. Flooding and mass-transport limits may stay hidden at low load.
For a broader test-method discussion, see PEM fuel cell performance testing.
Common Fuel Cell Flow Field Design Mistakes
Designing for the Lowest Possible Pressure Drop
Very low resistance can reduce pumping demand but weaken distribution and water removal. Evaluate net system power and local behavior.
Evaluating Total Flow but Ignoring Local Distribution
A sufficient inlet flow does not prove that every region receives enough reactant. Review velocity, concentration, and current density.
Ignoring Water at High Current Density
A design that performs well at low load may flood or show mass-transport losses at high load. Validation must cover the real duty cycle.
Making the Geometry More Complex Than Necessary
Extra branches, turns, or depth levels increase tolerance sensitivity and validation cost. Complexity should solve a measured problem.
Treating Nominal CAD Dimensions as Final Dimensions
Use inspection data from manufactured plates when reconciling simulation and test results. The actual profile controls the flow.
Trusting CFD Without Prototype Validation
Use CFD to rank and improve designs, then confirm the selected option with measurements.
A Practical Fuel Cell Flow Field Design Workflow
- Define operating requirements. Set current density, flow, pressure, humidity, temperature, active area, and duty cycle.
- Select the flow-field pattern. Compare serpentine, parallel, interdigitated, and other fuel cell flow field types.
- Define channel and land dimensions. Establish width, depth, land ratio, ports, and transition zones.
- Estimate pressure drop. Check hydraulic feasibility against balance-of-plant limits.
- Run CFD. Evaluate velocity, pressure, flow distribution, reactant concentration, water, and temperature.
- Review manufacturability. Check material thickness, feature depth, minimum web, tolerances, alignment, and inspection.
- Manufacture prototype plates. Record the process route and measure critical dimensions.
- Test and compare. Reconcile hydraulic, electrochemical, thermal, and water results with the model.
- Adjust and repeat. Update the geometry, model assumptions, or manufacturing controls based on evidence.
Requirements → Pattern → Dimensions → CFD → DFM → Prototype → Test → Optimize
When the design moves from one cell to a multi-cell assembly, review how plate resistance interacts with manifolds, cooling, and cell-to-cell balance in fuel cell stack design.
Fuel Cell Flow Field Design Checklist
Before releasing the design, check:
- Is flow distributed uniformly across the active area?
- Is pressure drop acceptable at rated flow and peak demand?
- Can liquid water leave the channels?
- Is membrane dry-out risk controlled?
- Have low-velocity and low-concentration zones been identified?
- Are ports and transition zones included in the CFD model?
- Are channel tolerances realistic for the manufacturing process?
- Can inspection verify the critical dimensions?
- Has CFD been compared with prototype measurements?
- Has performance been checked at high current density?
Frequently Asked Questions
What is the best flow field design for a PEM fuel cell?
There is no universal best design. The choice depends on active area, power density, pressure-drop limit, water management, operating conditions, and manufacturing constraints. Compare the main fuel cell flow field types before optimizing dimensions.
Why is pressure drop important in fuel cell flow fields?
Pressure drop affects reactant delivery, distribution, drainage, and pumping demand. Too much increases parasitic energy use; too little can make parallel flow unstable or weaken drainage.
How does channel depth affect fuel cell performance?
Channel depth changes cross-sectional area, velocity, and resistance. Its final effect depends on width, length, flow, water, and the rest of the field. See bipolar plate channel dimensions for detail.
How does CFD help fuel cell flow field design?
CFD can predict pressure, velocity, reactant concentration, temperature, and—with a suitable multiphase model—water distribution. It helps find low-flow regions before prototyping.
Can CFD replace fuel cell prototype testing?
No. CFD accuracy depends on geometry, boundary conditions, properties, and model assumptions. Prototype tests must confirm pressure drop, distribution, water behavior, and cell performance.
Why can manufactured bipolar plates perform differently from CFD models?
Actual plates may differ in channel depth, width, profile, flatness, alignment, or surface condition. Sealing, compression, gas properties, and liquid water add further differences.
Conclusion
Efficient fuel cell flow field design is a balance, not a single-parameter optimization problem. Pressure drop, flow uniformity, water transport, manufacturing accuracy, and validation must be considered together.
Engineers should select a suitable flow-field concept, define functional channel geometry, use CFD to identify risks, and then confirm the manufactured design through prototype testing. If you are preparing a metal bipolar plate for validation, TMNetch can review the drawing, critical flow features, and prototype requirements before manufacture. Submit your bipolar plate design for an engineering review.