
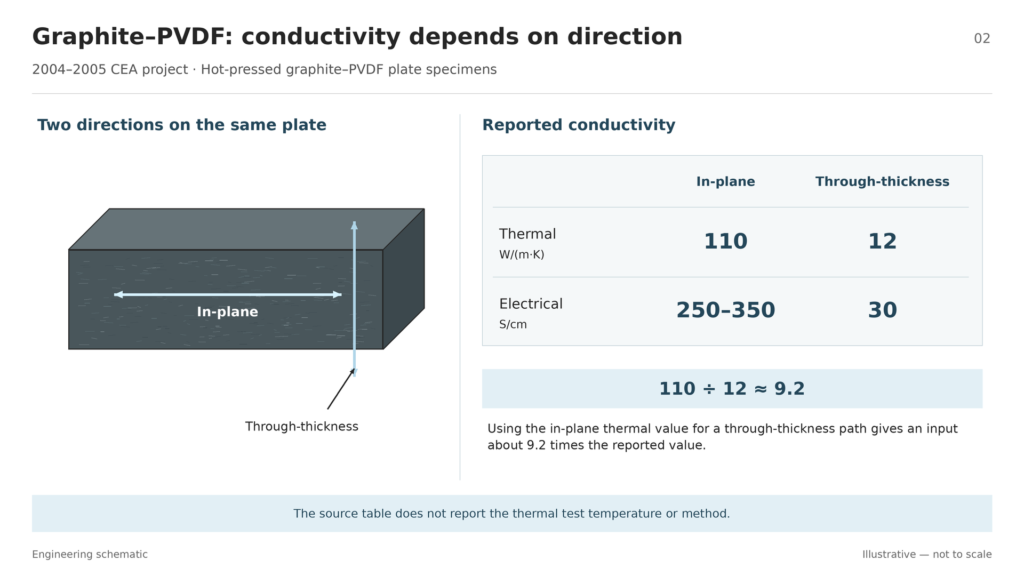
A graphite–PVDF plate sample had a thermal conductivity of 110 W/(m·K) along the plate and 12 W/(m·K) through its thickness. A separate 1,160-hour single-cell test used a gas-nitrided nickel–chromium model alloy. Both results are useful when the sample and test stay attached to the number. The first supplies a material property for a specified direction. The second documents how a particular plate system performed in one cell.
This guide examines research on bipolar plates for proton exchange membrane, or PEM, fuel cells. For an overview of the component, start with what bipolar plates do in a fuel cell stack.
Key takeaways
- Compare composite conductivity in the direction your design uses. Keep the formulation and measurement conditions with each value.
- Identify the metal and its surface treatment together. A deposited chromium nitride coating and a nitride grown from an alloy are different test specimens.
- Use published results to choose what to test next. Check the finished plate and assembly under your own operating and delivery requirements.
How to Read Bipolar Plate Material Research
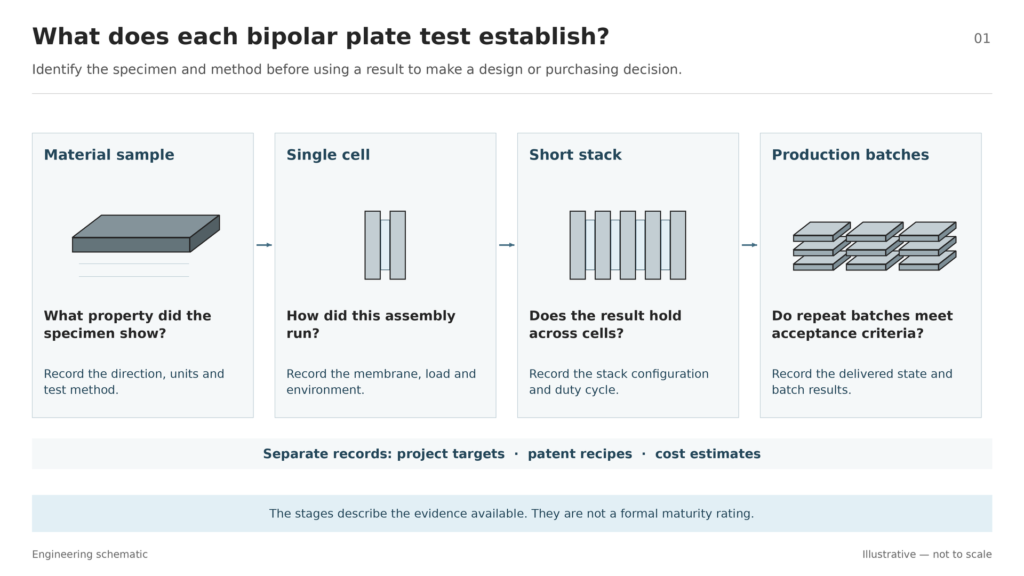
Start by naming the item that was tested. A hot-pressed material sample can supply conductivity data. A plate installed in a working cell can show how that configuration behaves under load. For example, the published PEM component targets list conductivity, area-specific resistance, corrosion current, and hydrogen permeation as separate measures. Keep those results separate when reviewing a candidate material.
For each result, record five things:
- Sample: Identify the alloy and surface treatment, or the filler and binder in a composite.
- Part condition: Record whether the sample was flat, patterned, joined, or tested in its finished surface condition.
- Method: Record the direction, units, and test conditions that matter to the measurement.
- Result: Identify the actual output, such as a conductivity value, a change in peak cell power, or the amount of metal detected in the membrane.
- Evidence stage: Distinguish material characterization, single-cell operation, short-stack testing, and production verification.
This is a way to read the evidence, rather than a formal maturity rating. Mark missing conditions as unreported and keep patents, project targets, and cost estimates in their own categories. If a single-cell result meets your screening needs, use it to plan the next test. For a delivery decision, ask for data from parts made under representative production conditions, including results across batches and the acceptance criteria used.
Graphite–PVDF Composites and Directional Conductivity
The 2004–2005 graphite–PVDF project hot-pressed a powder made from graphite platelets and polyvinylidene fluoride, or PVDF.
On those samples, thermal conductivity was 110 W/(m·K) in plane and 12 W/(m·K) through thickness. The same table gives electrical conductivity of 250–350 S/cm in plane and 30 S/cm through thickness. In plane means along the broad face of the plate. Through thickness means from one face toward the opposite face. If you use the in-plane value for a heat path through the plate, the resulting conductivity input would be more than nine times the reported value for that direction.
The physical properties table does not give the temperature or measurement method for thermal conductivity. The 80°C and 2 bar absolute conditions printed in the table belong to the helium permeation test. Ask for comparable test methods and temperatures before putting conductivity values from different sources side by side.
A separate patent formulation and pressing example used 80% graphite and 20% PVDF by weight, pressed at 185°C and 1 t/cm², as stated in Example 1. Keep that recipe with its own specimen. The CEA discussion of extrusion uses graphite content by volume, and its conductivity table is a separate record. Combining the patent recipe, extrusion statement, and conductivity values would give readers a formulation the sources do not establish.
Evidence stage: material characterization on hot-pressed plate samples. If you want to use the composite in a stack design, ask for results on the intended molded geometry, including its sealing areas and the properties you need in each direction. For a broader purchasing decision, see how to select a bipolar plate material by application.
Chromium Nitride Surface Systems on Metal Plates
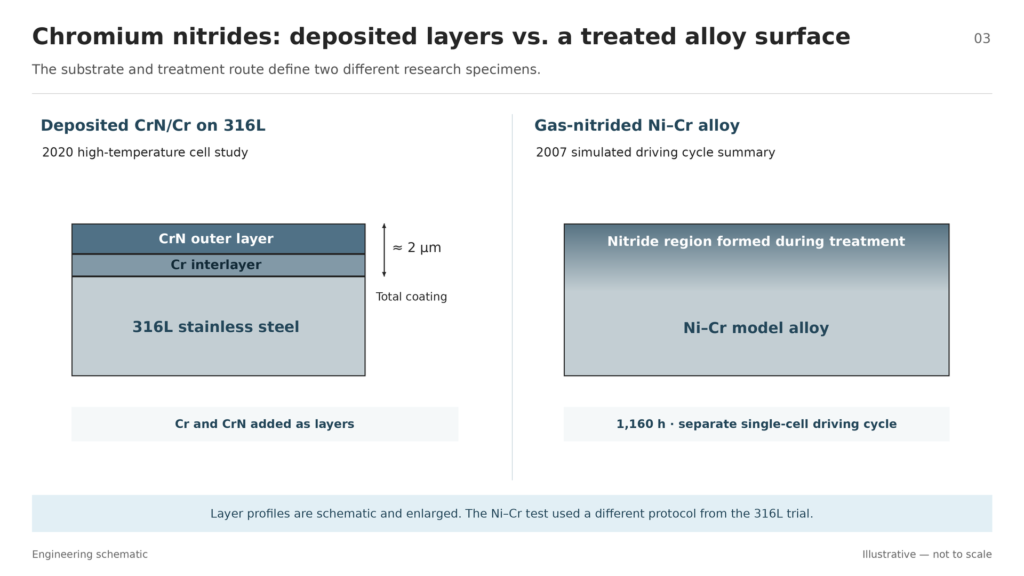
Keep the base alloy and the method of creating the surface together. The deposited CrN/Cr system used an inner chromium layer and an outer chromium nitride layer. In the gas-nitrided nickel–chromium work, the nitride surface grew during treatment of the alloy. Both approaches involve chromium nitrides, but each result belongs to its own metal, surface, and test.
CrN/Cr on 316L in a High-Temperature Cell
The 2020 high-temperature single-cell trial used machined 316L stainless steel plates with a CrN/Cr coating about 2 μm thick. Each cell used a polybenzimidazole, or PBI, membrane containing phosphoric acid. The cells ran on hydrogen and air at 160°C and atmospheric pressure. The durability run held current density at 0.2 A/cm² for 1,000 hours. Bare 316L and graphite served as the two comparison plate materials.
The voltage curves in Figure 4 show why the starting and ending measurements both matter. The cell with graphite plates led at the start. After the run, the curve for the CrN/Cr-coated plate cell stayed close to its own starting curve, while the bare steel and graphite cells each lost about 16% of maximum power. This was a change in cell output under that protocol. The curve reflects the assembled cell, so it cannot isolate plate contact resistance on its own.
Evidence stage: high-temperature single-cell durability test. Use the result to inform a test of a comparable coating and membrane system. For a different temperature range or a formed plate with a different surface finish, check the coating on the actual geometry and test it under the proposed conditions.
Gas-Nitrided Ni–Cr and Fe–Cr–V Alloys
The 1,160-hour figure belongs to a simulated driving cycle in a single cell using thermally nitrided Ni–Cr model alloy plates. The earlier test record identifies the alloy as Ni–50Cr and documents a stepped voltage cycle with shutdowns. The 2007 summary does not give the full operating schedule. Preserve the test description when using the duration; the deposited CrN/Cr system on 316L used a separate protocol and ran for 1,000 hours.
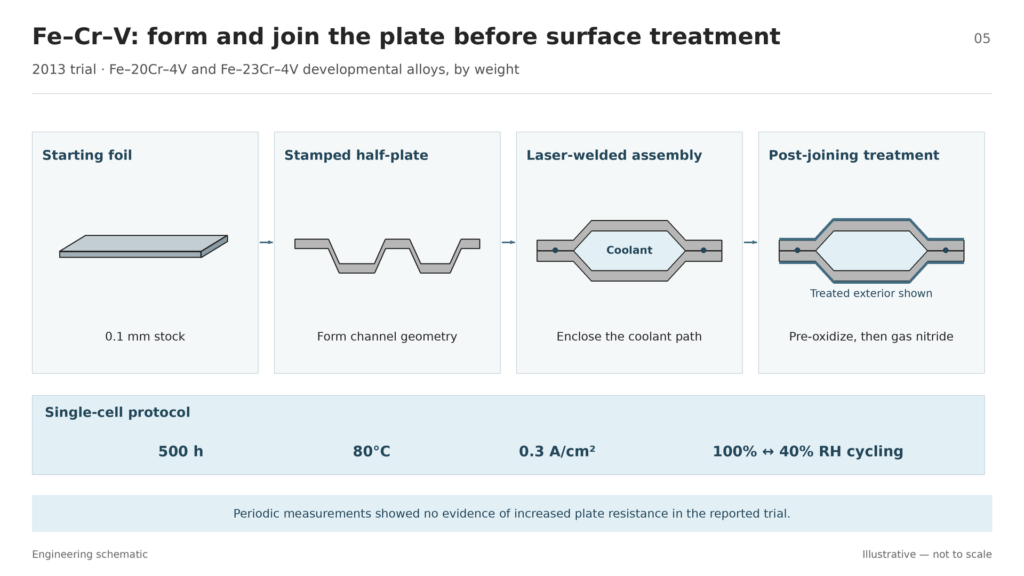
In the 2013 Fe–Cr–V plate trial, the starting material was 0.1 mm foil in two developmental compositions: Fe–20Cr–4V and Fe–23Cr–4V, specified by weight. Stamping formed the foils, and laser welding joined them into plate assemblies with cooling channels. The assemblies then underwent pre-oxidation and gas nitriding. The tested surface therefore came from treating the joined plate after forming and welding.
The single-cell program ran for 500 hours at 80°C and 0.3 A/cm², with fully humidified operation and cycling between 100% and 40% relative humidity. Periodic electrical measurements showed no evidence of an increase in plate resistance, and the membrane analysis found trace metal ions. The results apply to those assemblies and the recorded humidity program.
Evidence stage: single-cell validation of a joined plate assembly. When assessing transfer to another plate, specify the treatment sequence, then check the surface and electrical contact on the finished part. Review emerging metal bipolar plate manufacturing processes separately when the main question is how to form the geometry.
Historical target versus test result. The 2007 project table lists a stack durability goal of more than 5,000 hours under drive-cycle conditions and a $5/kW cost goal. The cost entry was still in progress. For a stack lifetime claim, request a test on the intended stack and duty cycle. For a cost decision, request the finished-part price at your volume and clarify which processing and inspections it covers.
What the Tests Establish and What to Verify on a Finished Plate
The three main examples measure different outcomes. Use the table to match each result to an engineering question before deciding what data to request.
| Sample and publication | Test conditions or method | Evidence stage | What to verify for your project |
|---|---|---|---|
| Graphite–PVDF, 2004–2005 | Directional properties of hot-pressed plates; thermal test temperature and method unreported in the table | Material characterization | Directional properties and sealing on the intended molded plate |
| CrN/Cr on 316L, 2020 | PBI cell, 160°C, hydrogen and air at atmospheric pressure, 0.2 A/cm², 1,000 hours | High-temperature single-cell test | Coating condition and durability on your geometry and duty cycle |
| Nitrided Fe–Cr–V, 2013 | Joined assembly, 80°C, 0.3 A/cm², 500 hours, humidity cycling | Single-cell test of assembled plates | Surface, contact, and leakage on finished assemblies from repeat batches |
Porous Nickel Foam: A Separate Distributor Example
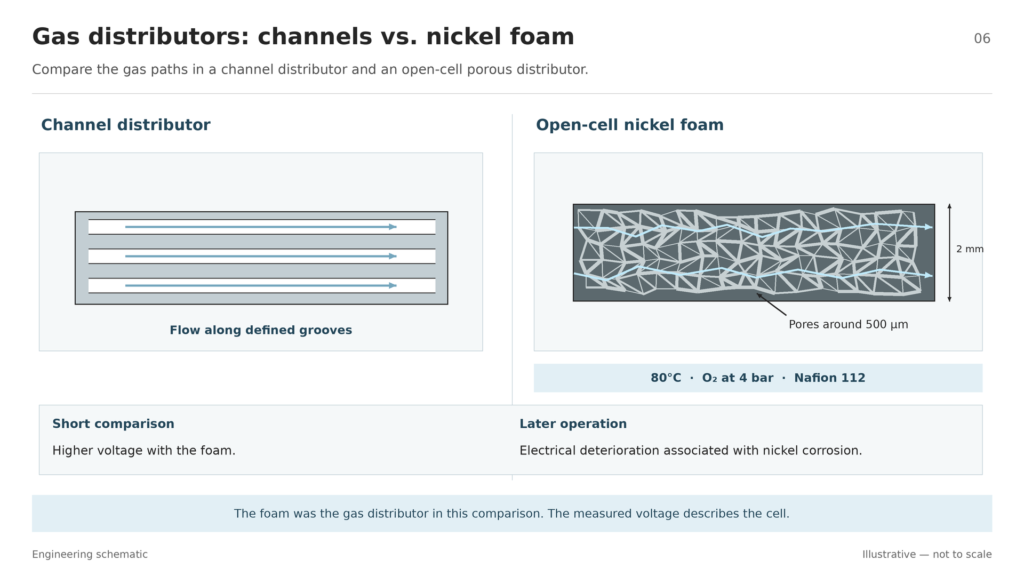
In a short single-cell comparison with channel distributors, the porous distributor was 2 mm thick nickel foam with pores around 500 μm. Figure 3 gives 80°C, oxygen at 4 bar, and a Nafion 112 membrane. The foam gave higher voltage in the short comparison. The same project account records electrical deterioration over time associated with corrosion of the nickel structure. Use the case to assess a distributor under the intended conditions, including how it holds up after the initial test.
For a finished plate review, make three comparisons:
- Match the part state. Compare the same base material, surface condition, and geometry. Identify where the sample came from on the plate.
- Match the conditions. Record temperature, humidity, potential or load, contact pressure where relevant, and test duration. The bipolar plate test notes illustrate how these variables accompany corrosion and contact measurements.
- Check the delivered assembly. Confirm dimensions, surface condition, electrical contact, and sealing in the configuration the project will receive. Write the acceptance criteria before ordering the next batch.
Where Chemical Etching Fits in Metal Plate Development
After choosing a candidate alloy and sheet thickness, check whether photochemical etching fits the drawing. A patterned resist defines where the process removes metal. For a fuel cell plate, use the etched flow field design review to identify channel sections, ports, sealing areas, and the minimum wall that must remain.
Set the delivery boundary before requesting samples. A patterned half-plate, a joined plate, and a plate with its final coating each need their own inspection scope. If the next test concerns the final surface, specify whether it will be applied before or after joining and identify which part condition will enter the cell.
TMNetch Case: Different Coatings on the Two Faces
One TMNetch custom bipolar plate example specifies platinum plating on one face and a mixed metal oxide coating on the other. The published case identifies the coating arrangement and leaves the thickness and operating test results unreported. For a similar request, mark the two faces on the drawing, define which areas receive each coating, and agree how to inspect the finished surfaces before testing them in a cell.
Review Your Metal Bipolar Plate Prototype
Planning custom etched bipolar plates? Share your alloy, sheet thickness, channel drawing, and final surface requirements with TMNetch for a chemical etching feasibility review. Include the intended delivery state so we can review the geometry and inspection scope together.